SaaS metrics help you make decisions to guide your company. Rolling SaaS metrics hide trending problems behind analytics that lack any temporal context.
What is the point of calculating and tracking your SaaS metrics?
While pretty charts and graphs are great to see how much money or users are coming into your business, the goal of metrics is to help you make decisions to guide your company. They're signposts (or a compass metric) to point you in the right direction of problems, causes, and ultimately solutions.
That being said, we're noticing a startling trend in some metrics dashboards and approaches that are essentially moving those signposts every single day with rolling 30 day metrics. By utilizing rolling 30 day metrics you're essentially opening yourself up to hiding trending problems behind analytics that lack any temporal context. Basically, you have no idea what's actually going on in your business.
To understand why rolling metrics are an awful analytical framework, let's answer - what exactly are rolling metrics? We'll then walk through what questions you should be asking and answering with your metrics and why rolling metrics don't fulfill these SaaSy needs.
What are rolling metrics?
You may think we're the nerdiest folks on the planet for caring so much about "analytical frameworks with temporal context", but that's part of our job to make sure we're not just taking a bunch of data and converting it into a bunch of meaningless graphs. Context and perspective in your SaaS metrics matter, because that's the only way you'll end up truly getting insight.
Analytics soapbox aside, when you're computing SaaS metrics (or most time based metrics in general) there are three main timeframes you can use:
- Historic timeframe — July 1 to July 31
- X-to-date — August 1st thru today.
- Rolling timeframes — past 30 days
A historic timeframe has a stationary startpoint and a stationary endpoint. It might be the whole of last month or the whole of last year. It is a timeframe for a time that’s passed for which you have all of the data. An example question for this type of timeframe may be, "what was our growth for 2014?"
An X-to-date timeframe has a stationary startpoint but a moving endpoint. In this manner each period of time starts fresh and builds towards an endpoint in real time. Sales quotas, growth waterfall charts, and most goals follow this framework.
A rolling timeframe has a moving startpoint and a moving endpoint. New information is accrued in your current numbers, but the window of time you see is always shifting. There is no defined start, it's constantly moving and can almost be thought of as the reverse of the X-to-date framework for a given period.
What’s happening in real time? X-to-date and rolling metrics
To expand a bit on why rolling metrics are great in theory, but horrible in execution, we need to dig into one of the fundamental questions answered through your metrics - what's happening in real-time or near real-time? This is how you end up using your analytics as an early warning system to damaging or winning trends.
X-to-Date
X-to-date solves this problem by showing how your revenue is growing this month so far, alongside your previous month's revenue through the entire month for comparison. You zero the growth at the start of the month for easier side-by-side comparison. You're able to also compare more readily different periods, because things reset to zero over a period:
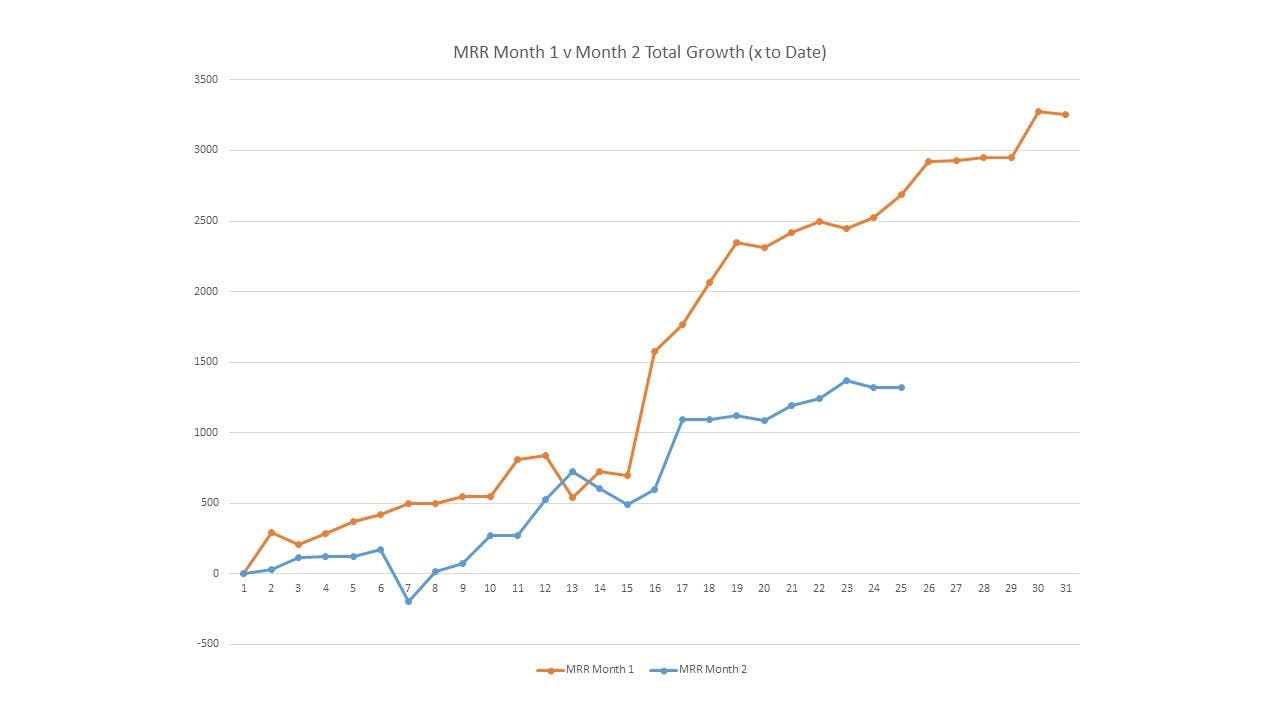
In the above chart, last month's total growth is in orange, and this month's so far is in blue. In this example, this month isn't going as well as last month in terms of MRR growth. The chart ends on the 25th (our imaginary today), and if you wanted to match or exceed last month's growth you are going to have to do something exceptional in the next week.
Rolling growth
Rolling metrics on the other hand update every day, but with a new starting day as their foundation. This doesn't impact the underlying MRR, but changes the growth rate substantially and deceivingly. In this scenario growth on day d is the % growth from d-30 days.
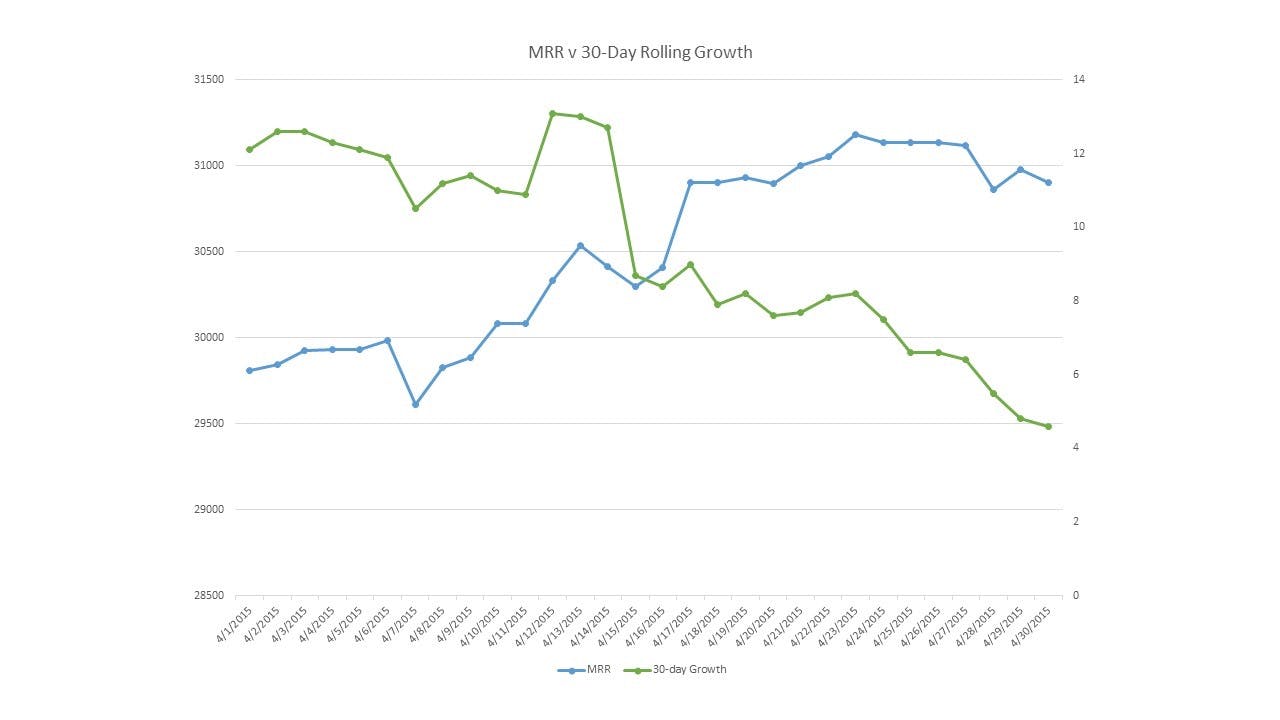
Here the month's MRR is in blue again (the same month as above, only now for the full month). In green is the daily rolling growth rate. This is measured as the growth over the previous 30 days, so on day 1 you are looking back to what the MRR was 30 days previously, and computing the growth from that number.
This 30 days constantly moves creating some extremely odd effects. For instance, though the MRR is steadily growing through the month, the 30-day rolling growth rate is falling, as each day is worse than the day 30 days previous.
Why is the Rolling Metric framework bad? Two reasons.
While rolling metrics may make you feel like you're moving, they're exceptionally dangerous, because they give you the feeling of momentum while deceptively hiding what's actually going on in your business. More specifically, rolling metrics make true comparison nearly impossible and unfortunately remove all context between your optimizations and results.
They make comparison impossible - Costing you progress
With ProfitWell (which uses the X-to-Date framework), if your growth rate this month was 15%, and your growth rate last month was 5%, you can say that this month was better than last.
With rolling metrics, what can you say with the same numbers? Not much at all. Your ability to make internal comparisons has been destroyed because growth rates on subsequent days are calculated from different starting points constantly.
Rather than having just 1 variable—which day is used for “today”—rolling metrics have 2: the start date and the end date. These rolling start and end dates start to hide how well you're progressing or regressing because everything is constantly moving. You have no signpost for comparison.
If your growth rate today was 5% and yesterday was 4% that might mean that today was better, or it might mean that you had a good followed by bad day a month ago. The only way to have a pure reading from rolling metrics is if you have no growth at all. Anything else, up or down, will cause artifacts and bizarre behavior over shorter periods of time.
They remove all context - Costing you insight
Worse yet, with rolling metrics, you’re now more likely to misattribute the cause of changes in your numbers. You think MRR Churn changed this week because you added a new feature or sent an email, but it actually changed as a result of something that happened a month ago. When you make a decision based on that faulty reasoning, your metrics are essentially all vanity, because they're just not useful.
To illustrate this a bit differently, think of the fact that businesses don't work on rolling 30-day projects. Businesses work on weekly, monthly, quarterly, and yearly goals, signposts, and projects. If you don't understand how your metrics improved or regressed from one day to the next or how things are trending across a specific period of time, you don't know how well all of those efforts that go into improving those metrics are doing.
Remember that metrics are about communication. They tell you what is happening in your company. They are the signpost for growth, telling you what has and hasn't worked in terms of features, marketing, sales, and experiments. If you cannot communicate your metrics in the context of how your team thinks about time, all is lost.

Take the headache out of growing your software business
We handle your payments, tax, subscription management and more, so you can focus on growing your software and subscription business.
How should you be thinking about your metrics?
It’s easy to forget, but you don’t have metrics just to show you pretty graphics and look at long term trends.
Metrics are there to help you see your company clearly and determine where you're having trouble or massive opportunities to step on the gas. Specifically, here are the three questions you should be consistently asking yourself with your analytics:
How are we performing?
This is the most basic question that you are going to be asking your metrics every week. When we talk about a compass metrics this is what you really want to know - how is your company performing against your goals? Or against industry benchmarks? Were there dips in MRR this week, an increase in churn, or a slowdown in growth?
What caused that upward or downward trend?
Once you know how you performed, the next thing you need to know is what happened to cause that performance. If you saw an dip in growth last week, what caused that? Was it an internal change or an external event? This is where you take a deeper dive into your performance numbers to understand what causes increases and decreases in your performance by looking at attribution and deeper parts of your business or customer that changed
How can we make changes to continue the upward trend or turn a downward one around?
Once you know how you performed and what happened to cause that performance, you then need to ask yourself what decisions need to be made to continue or stem the trends you're seeing. Only with the information from your metrics can you make an informed decisions about the future of you company.
In the age of big data and metric porn, one can easily find themselves just going for the prettiest graphs they can find (and as many of them as possible). Remember though, your analytics serve a finite purpose - to give you signposts and insight.