Keeping churn rates as low as possible is the key strategy for subscription and SaaS businesses. But what does good look like?

It’s the question on every SaaS founder’s lips: Is my churn rate too high?
While it might sound like a simple question on the surface, the answer is anything but. A “good” churn rate for one company might be terrible for another. Worse, comparing average churn rates across different markets and industries will leave you mired in confusing statistics and contradicting studies.
So how do you know what a healthy churn rate is for your SaaS company? Why is it so hard to define an average churn rate—and what does that mean for your subscription business?
Let’s find out.
What is churn rate?
Churn rate is an expression of the number of customers that a business loses over a given period of time. . Put alongside new customer acquisition, your churn rate will quickly tell you if your existing customer base has, or is expected to, expand or contract. It's a fundamental indicator of business performance, as high churn is often the result of dissatisfaction. Therefore, exploring the reasons for churn is the first step in mitigating it.
Example: A business has 100 customers in January. In February, 90 of those customers remain. This can be expressed as a customer churn rate of 10%
What is the typical SaaS churn rate?
SaaS churn measures the number of SaaS customers who cancel their subscriptions for a given period. This metric indicates the long-term viability of a SaaS business, as higher churn means a company is losing out on customers and revenue. To streamline SaaS growth, businesses should strive to maintain an average SaaS churn rate between 3 and 8%. That said, churn rate varies based on industry and every business should have a good idea of their industry benchmark.
What is the average churn rate?
In SaaS, the average churn rate is around 5%, and a “good” churn rate is considered 3% or less. However, this varies greatly across businesses and industries, so in reality, there is no universal “average” churn rate. Churn (aka customer attrition) targets tend to fall all over the map, and everyone has a different idea of what an acceptable churn rate looks like.
The fact that there’s no B2B subscription reporting method for churn or any other metric doesn’t help. Some companies report revenue churn, others only share customer or user churn numbers, and often there’s no distinction between whether churn numbers are annual or monthly doesn’t help. Some companies report revenue churn, others only share customer or user churn numbers, and often there’s no distinction between annual or monthly churn.
I mean, just take a look at all these different surveys:
A KBCM Technology Group survey reported a median annual revenue churn rate of 13.2% and a logo churn rate of 21% among 162 respondents (although this excluded companies with less than $5m in revenue).
Zuora’s 2019 Subscription Economy Index reports average customer churn rates across a number of different industries, ranging from Business Services on the low end (16.2% customer churn rate) to Media on the high end (37.1% customer churn rate).
While the data’s a tad older, Totango’s 2016 SaaS Metrics Report lists a wide band of churn rates across its respondents, with the median annual churn rate falling somewhere in the 5-10% range.
Nathan Latka interviews founders and publishes their SaaS metrics on his website—the average gross churn rate of the 300 listed companies is 16.8%. While it’s not listed specifically, I assume these are monthly churn numbers.
Subscription service Recurly reports an average monthly churn rate of 5.6% across a sample of over 1,500 sites. Its churn numbers vary between B2B and B2C, with B2C companies experiencing much higher churn (7.05%) than B2B (5%).
So based on this data, the average churn rate (specifically the average monthly revenue churn rate) could be anywhere from 1% to 17%, with most studies reporting the median monthly churn rate in the 5-10% range.

5 factors that explain why average churn numbers vary so much
Average churn numbers fall all over the map because every company is different, and every market is different.
Churn rates for subscription companies vary widely across both external dimensions (like the market you’re in and your target customers’ willingness to pay) and internal dimensions (like your chosen pricing structure, contract lengths, and company age).
Let's take a look at five specific factors that appear to correlate with variations in average churn rate:
- Industry
- ARPU
- Contract length
- Company age
- Company funding
1. Average churn rates vary across industries
Every industry has different factors that affect churn.
Subscription platform Recurly sampled over 1,500 subscription companies in 2018 from across their customer base using their platform to understand the average churn rate by industry.
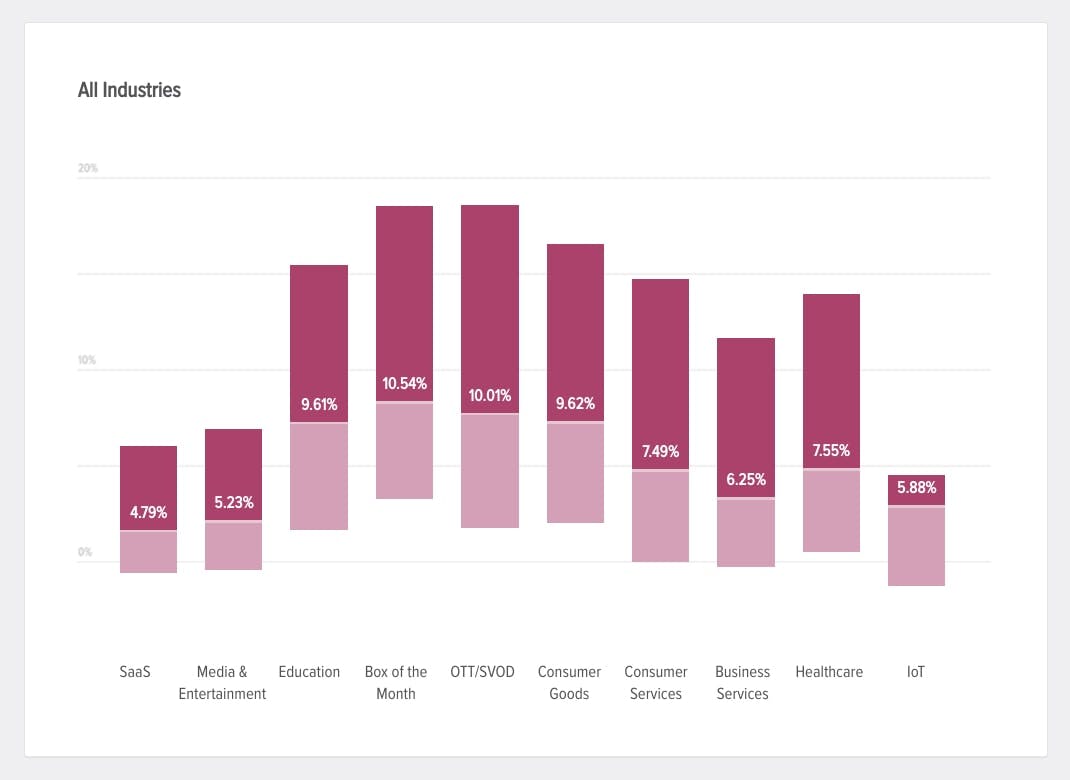
Average churn rate by industry. Image via Recurly.
The data tells a clear story:
- The average churn rate for SaaS companies landed around 4.8%, with upper and lower quartiles of 8.5% and 2.9%, respectively.
- Media and entertainment services recorded monthly churn of roughly 5.2%.
- Healthcare subscription services came in a little higher at around 7.5%.
- Education services and consumer goods saw identical monthly churn rates of around 9.6%.
- Subscription boxes were the highest of the bunch, with monthly churn of 10.54%.
The biggest variations between average churn rate by industry depend on whether services are sold to businesses or consumers. SaaS, for example, includes a higher proportion of B2B products and services, all of which tend to experience lower churn. Consumer services, like subscription boxes and entertainment services like Netflix and YouTube, have a comparatively higher churn rate since the services aren’t seen as “essential.”
Check out our guide on customer retention rates by industry for more info.
2. Higher ARPU correlates to less churn
Churn can also vary widely based on your pricing. Companies with low average revenue per user (ARPU) see much higher churn than those with larger ARPU.
Say your average revenue per user per month is less than $100. You’re likely seeing monthly gross revenue churn rates between 3-16%, with a median between 6-9%. That’s a lot of churn.
Yet, companies with an ARPU of more than $500 see significantly less revenue churn, with a range of roughly 2-6% and a median closer to 3-4%.
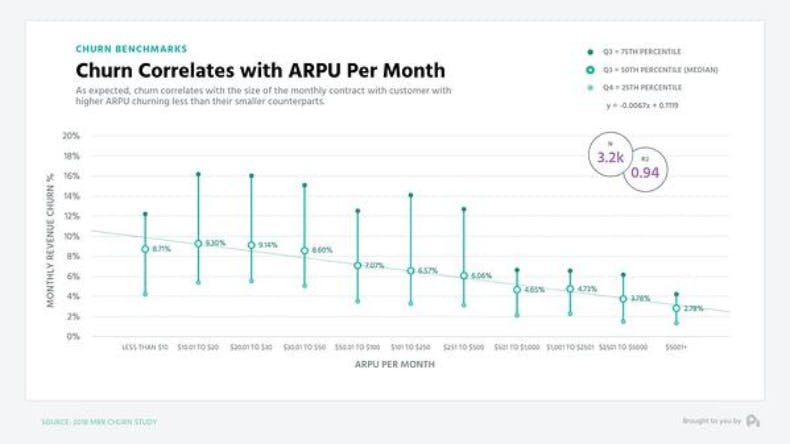
Of course, this is intuitive. Those higher ARPUs tend to come with more hand-holding, annual contracts, and a deeper relationship with your customer base—all of which are afforded through higher revenues per user. Lower-priced products and B2C services take less consideration before making a purchase—and likewise, less consideration before canceling a subscription.
3. Longer contracts reduce churn
Existing customers are less likely to churn than new customers. Companies with a higher percentage of customers on annual (or longer) contracts tend to experience lower churn rates and higher lifetime value than companies that primarily offer monthly contracts.
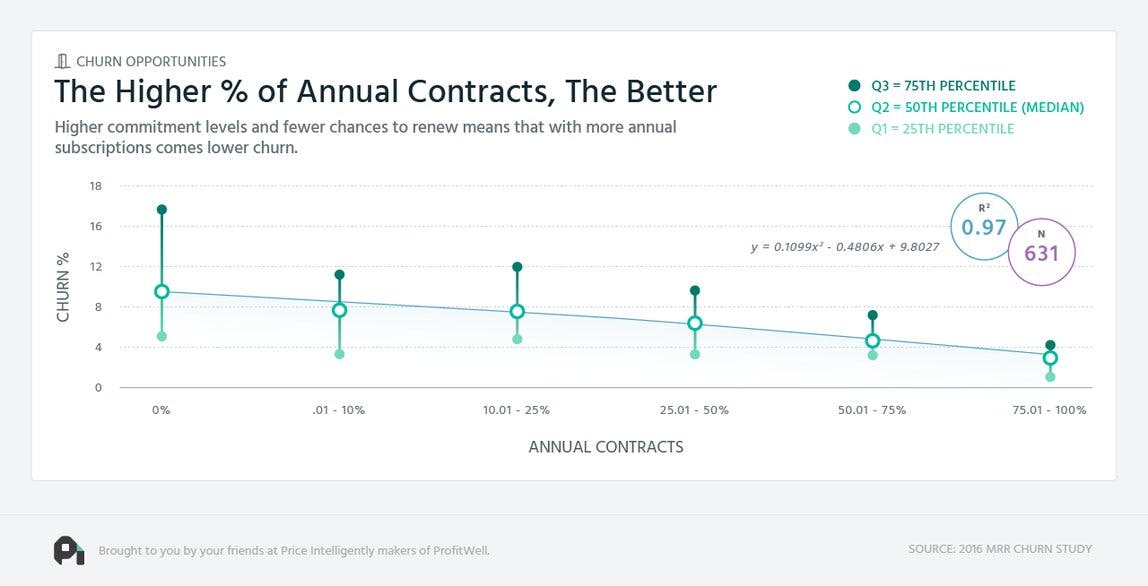
There are two reasons churn goes down for longer contracts. Annual contracts give new customers fewer chances to renew and, therefore, fewer chances to churn. With an annual contract, there's only one opportunity for a customer to churn out, as opposed to 12 with a monthly contract.
Annual contracts also tend to attract higher-value customers. These customers believe in you—signing a longer contract is a strong sign your customers are willing to commit to your product. If they're willing to make such a big monetary commitment, they're likely more invested in using your product to win and less likely to churn out after a short time period.
4. Older companies experience less churn
Like a fine wine, churn gets better with age. Established companies have dramatically lower churn than their younger counterparts.
Companies that are less than three years old are seeing a churn range spread from 4% to a whopping 24%, whereas companies 10+ years old are seeing churn in the 2% to 4% range.
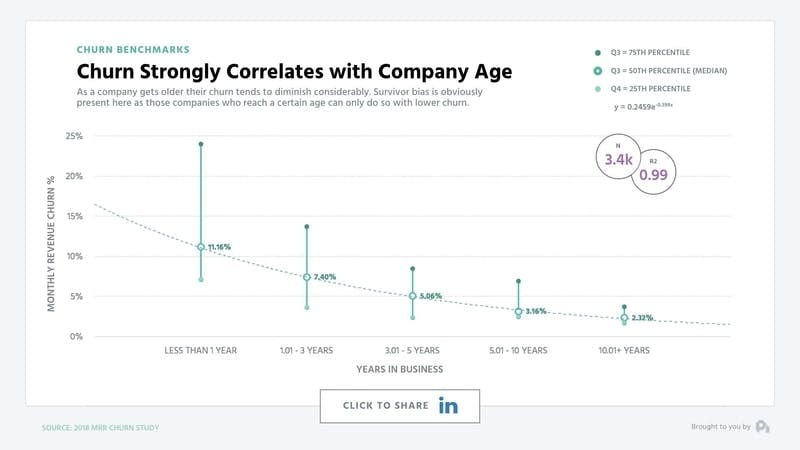
Why? As companies age, they get much better at understanding their customers’ needs and positioning their products and business model to meet those needs. Hence, those customers tend to stick with the company longer. There’s also an element of survivorship bias—companies that don’t figure out their high churn problems tend not to survive past a few years.
5. Funded companies have higher churn rates
Venture money can solve a lot of problems, but churn isn’t always one of them.
Interestingly, venture-funded companies experience notably higher churn than those that didn't take on funding. In fact, churn rates for funded companies tend to be 20-30% higher than their bootstrapped counterparts.
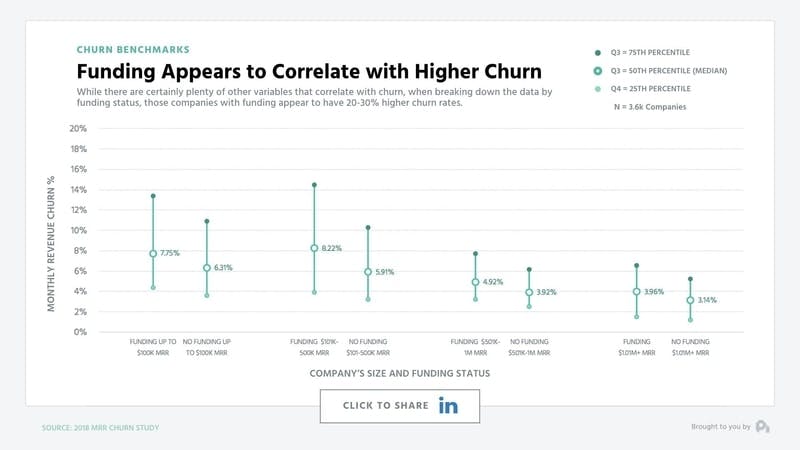
Venture funding creates a false sense of security. Funding masks core problems that simply get bigger as the company gets bigger—in essence, letting you use a sledgehammer when you really should be using a scalpel. Founders are much more likely to spend their way out of growth holes when they’re gambling with someone else’s money.
Meal delivery services like Blue Apron are a prime example of this problem. Its average churn rate ended up being so high, that all the customer acquisition spend and product add-ons in the world weren’t enough to offset losing such a high number of customers.
Is there such a thing as a “good” churn rate?
In the dynamic and highly competitive SaaS markets, it can be hard to judge what constitutes a “good” churn rate. This is particularly true for startups that have little historical data to compare against, making churn analysis extra tricky. It's tempting for businesses to seek out industry benchmarks, and use those as gauges of success. But even if you leave to one side the accuracy of a given benchmark, there are fundamental challenges in comparing churn across different SaaS businesses.
- Maturity - an established SaaS business that has built a strong reputation and large user footprints can expect to have lower churn indicators than a startup that may be one of a number of vendors that a business is trying out.
- Business model - some churn is expected, even designed for. For example, it can be a valid business strategy to dispose of unprofitable subscribers, or to purge dormant or fake accounts. Other SaaS businesses are not designed for long-term use, such as dating apps or a job search platforms.
- Business objective - a business targeting rapid growth is likely to attract new subscribers with discounts and offers, fully expecting that only a percentage will be retained.
- Customer type - in some SaaS sectors, it's more normal to switch suppliers in search of the best deal regularly. Other sectors, such as complex technology infrastructure and business-critical systems, have far more stable subscribers and, therefore, less churn.
- Macro influences - some SaaS businesses are more subject to macroeconomic pressures, new government policies and regulatory forces. For example, a change in law may require a gambling or gaming platform to close underage accounts; or prohibit trade in cryptocurrencies. In such cases, we predict higher churn rates.
According to our studies, the average churn rates for SaaS companies are all over the map—everywhere from 1-20% of MRR (monthly recurring revenue). Therefore, a churn rate at the low end (2%) would be considered “good.”
But that doesn’t tell the whole story. Since every company, product, and market is different, it’s impossible to properly compare churn rates across different companies. There are just too many factors in play.
So what benchmarks should subscription companies aim for? What is a good churn rate?
Established companies should aim for steady, low churn
For established companies and enterprise products that have found product-market fit, revenue churn should be low and stay low. Jumping back to our ARPU data from earlier, companies with ARPUs in the $500+ range should have an average churn somewhere in the 2-4% range—but ideally no more than 6%. These numbers are backed up in our company age studies—companies over three years old should be in the same range.
Early-stage companies should aim to improve churn over time
For early-stage companies still searching for product-market fit, though, it depends. Churn in the first year tends to be much higher, often hovering around 10-15% per month (and ranging as high as 24%) as companies figure out their product marketing and pricing strategies to fit their target customers.
As you get better at finding and retaining more ideal customers, that rate should go down over time. Your best benchmark should be your own metrics from last week, last month, or last year.
The best answer I can give is: track your churn and find ways to improve your churn rate over time. Keeping the ship pointed in the right direction is more important than spending your time focusing on your specific churn rate—and certainly more important than comparing it to your competitors.
Practical tips for reducing churn rate
There’s no silver bullet when it comes to improving your average churn rates. Every subscription company struggles with churn for different reasons—what works for one company might not work for yours.
There are, however, a few concrete things every subscription company can improve to bring down a high churn rate.
Increase your proportion of annual contracts
Annual plans are essential when reducing churn, yet KBCM reports that nearly 20% of SaaS companies still have an average contract length of less than one year. There’s no excuse for a SaaS company not to be offering annual contracts—increasing your proportion of annual to monthly plans is one of the fastest ways SaaS companies can reduce churn.
Some tips for encouraging customers to sign annual contracts:
- Email customers and offer a discount for switching to an annual plan.
- Offer a discount over monthly plans (I recommend reducing prices by 15-20%).
- Highlight the savings on annual plans on your pricing page.
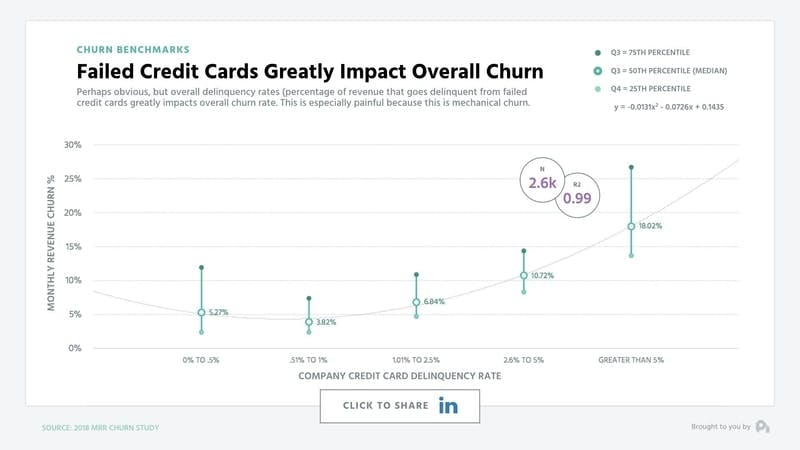
Bring down your payment failure rate
Credit card delinquencies are another leading churn factor you can easily fix. Up to 20-40% of churn is typically caused by credit card failures, and most companies don’t have a good solution for combating this churn.
Tackle each of the four sides to churn
Approach churn not as a single problem, but as multiple mini-projects, each with its own strategy and set of tactics. The following grid can be a helpful way to think about this.
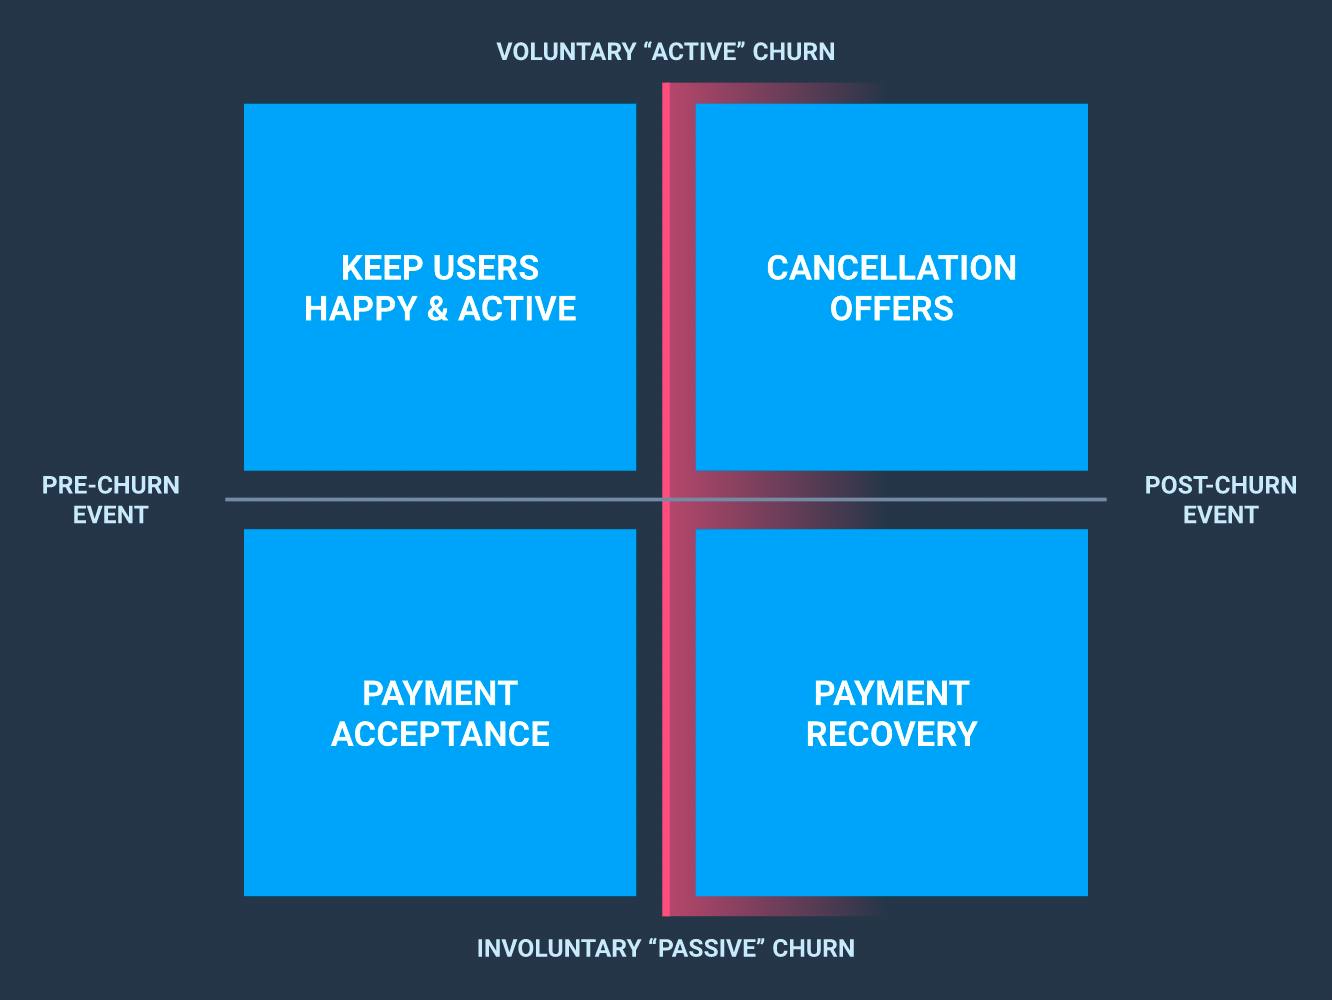
Each quadrant represents the intersection between a moment in time (i.e., when in the subscription lifecycle is the churn occurring?) and the subscriber’s intent (i.e., what is the cause of the churn?)
- Top left - a proactive strategy to ensure subscribers continue to get value from your service and so prevent churn from happening (e.g., in-app messaging and walkthroughs can improve user onboarding and new feature adoption.)
- Bottom left - establish the payment mechanisms are in place to successfully process a subscription renewal (e.g., for international transactions, route payments through local acquirers and intermediaries to avoid them being flagged as suspicious, and to ensure consistency in data formatting between different banking systems.)
- Top right - a timely response to dissuade customers against ending their subscription (e.g., directing a cancellation request to a webpage that restates your value proposition, captures and addresses the specific cancellation reason, or makes the customer an offer to stay.)
- Bottom right - remedying issues that have resulted in a payment failure, in time for the subscription to continue (e.g., a dunning program designed to retry failed payments, or to prompt the customer to supply new payment details.)
How your billing operations impact churn rate
As we have said, churn is not just about falling out of love with a product. Other drivers of churn, such as CRM, subscription management, customer communication and payment management, need to be considered. None exist in isolation. For example, a CRM entry should include payment details and, ideally, automatically trigger communication to a customer if these are out of date.
This is difficult when you manage these processes via integrations with multiple tools across your payments and billing infrastructure. Therefore investing in a unified revenue delivery platform that brings all these requirements under one roof to automate many interactions is an effective strategy.
Here are five ways effective billing operations impact the churn rate in Saas and subscription businesses.
1. Automated reactivation flows
Customers who intend to cancel their subscription can be persuaded against doing so. The issue for sellers is having enough resources to have that conversation in time. It's better if you can automatically funnel at-risk subscribers through a program of communications and engagements, which are tailored to the things you know about them and their likely reasons for wanting to leave you.
2. Flexible subscriptions
Sometimes, SaaS customers churn because they're faced with an all-or-nothing proposition; and on balance, nothing makes more sense. But sometimes, customers just want a little less of your service; sometimes over a specific period of time or to change the frequency of their payments so they're paying slightly less each time, but over a longer period. (And they can get equally frustrated if they want to ramp up consumption or pay more in fewer installments, but are unable to do so.) Giving customers not only greater choice in subscription packages, but also ease in switching between them, provides control and confidence in their ROI.
3. Automatic payment update
The biggest cause of involuntary churn is a payment failing because the payment details are incorrect. Here, card payments are a particular issue. Anti-fraud laws dictate that cards must expire after three years, and of course customers can lose theirs or have them stolen in the meantime.
Expired cards are relatively easy for a vendor to mitigate against because they know when the card will expire and can prompt the subscriber to update their details in time to take the next payment. This preemptive strike is not possible with lost and stolen cards; but timeliness in letting the customer know their card was rejected and directing them to update their new card details still makes a big difference.
Think — the email you get from Netflix that stops you from binge-watching that true-crime documentary until you update your payment details — that’s churn prevention in action.
4. Smart payment routing
Even with a strategy in place, some subscription payments will inevitably fail. It can happen for a range of reasons, other than an outdated card. One is the route a payment takes from the customer’s bank to the merchant’s bank. If that route crosses borders, where the two banking systems have little in common, the payment can be hard to reconcile and get flagged as suspicious, triggering an immediate stop to proceedings. But not all is lost. With access to the right technology, merchants can reroute the transaction through more accommodating intermediaries.
5. Payment preference
Letting customers pay how they want to is a good bet for keeping them happy. But that's easier said than done. Though the major card networks, bank debit schemes, and checks (in the U.S at least) still dominate, but alternative payment methods are growing in popularity. A competitor that offers a payment method that is favored by a customer may be all it takes for them to win business away from you.
But businesses that want to offer more payment options have two major challenges. Firstly, payment preference varies wildly across countries and sectors. Secondly, they aren’t always easy to access. Some require you to establish a legal entity in a specific country, some have minimum transaction volumes that must be met, and others require significant IT involvement to integrate them into your payment system. A unified revenue delivery solution is more likely to have multiple payment methods and currencies for you to access, without the need for yet more integrations.

Cut customer churn by 25-30%*, automatically with Retain
Win back customers before they're lost forever with automated dunning and churn intervention.
* Seriously, we tested it
SaaS churn rate FAQs
What is a good churn rate for SaaS?
A good annual churn rate for SaaS is between 5% and 7%, whereas the average monthly churn rate should be under 1%. When it comes to startup companies and SMBs, they should aim to keep their churn rate between 10%-15% for the first year and maintain a monthly churn rate below 5%.
What is the average churn rate for SaaS?
An average acceptable churn rate for SaaS businesses falls anywhere between 3%-8%, while an annual churn rate for a SaaS product can vary between 32%-50%.
What is a negative churn?
Negative churn indicates that the revenue earned from existing customers exceeds customer downgrades and cancellations.